Introduction of Fault Tree Analysis:
In the world of safety, reliability, and risk assessment, Fault Tree Analysis (FTA) stands as one of the most effective and systematic techniques. It helps safety professionals, engineers, and decision-makers pinpoint the root causes of system failures and proactively prevent them. This blog will guide you through the definition, methodology, symbols, benefits, limitations, and real-world applications of Fault Tree Analysis.
What is Fault Tree Analysis (FTA)?
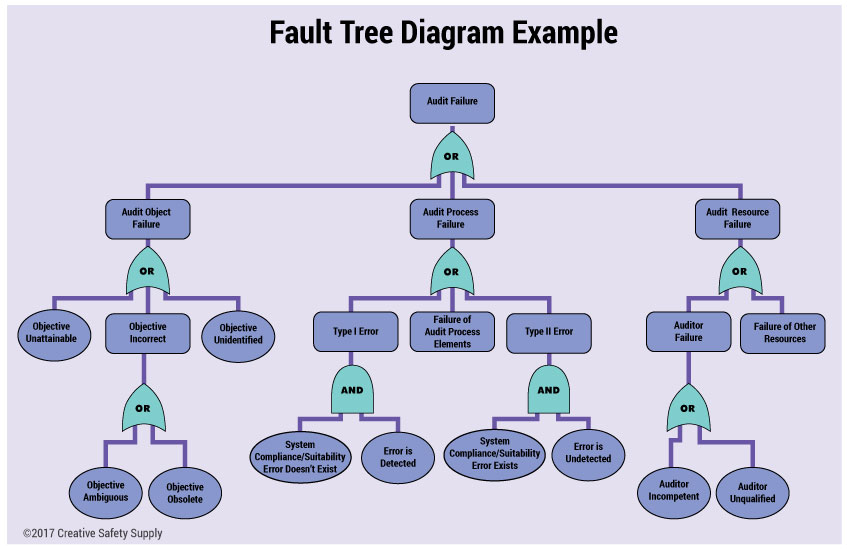
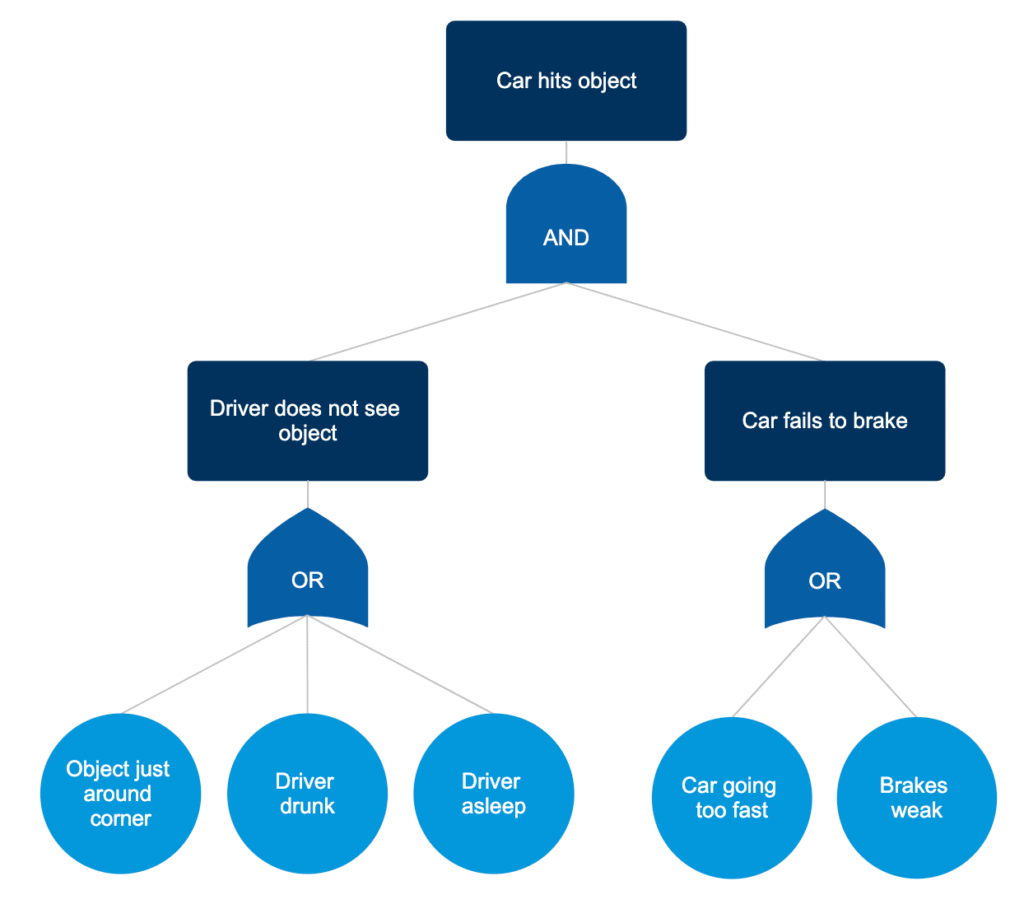
Fault Tree Analysis (FTA) is a top-down, deductive failure analysis method used to determine the causes of a specific system failure (called the “top event”). It visually maps out the paths to failure using logic symbols and a tree-like structure.
Fault Tree Analysis was first developed in the 1960s by Bell Laboratories for the U.S. Air Force to evaluate the reliability of missile systems, and today, it is widely used across industries like aerospace, manufacturing, chemical processing, and safety engineering.

Why Use Fault Tree Analysis
- To identify potential causes of system-level failures
- To prioritize risks and focus preventive efforts
- To improve the design and reliability of systems
- To meet safety standards and regulatory requirements
- To support decision-making in risk management
Basic Concepts and Symbols in Fault Tree Analysis
FTA uses logic gates and event symbols to build a fault tree. Here’s an overview of common elements:
1. Top Event:
This is the primary undesired event or failure that the analysis focuses on (e.g., “Fire alarm failure”).
2. Basic Events:
The root causes or individual component failures that contribute to the top event.
3. Intermediate Events:
Events caused by one or more basic events or other intermediate events.
4. Logic Gates:
These symbols define the relationship between events:
- AND Gate (∧): All input events must occur for the output event to happen.
- OR Gate (∨): Any one of the input events causes the output event.
5. Other Symbols:
- House Event: A known condition that is always true or false.
- Undeveloped Event: An event not further analyzed, often due to lack of information.
- Transfer Symbol: Indicates that the branch continues on another part of the tree.
Steps to Conduct a Fault Tree Analysis
- Define the Top Event: Clearly state the undesired outcome.
- Understand the System: Gather data, design diagrams, and process knowledge.
- Build the Fault Tree: Use logic gates to map causes down to basic events.
- Qualitative Analysis: Identify minimal cut sets (smallest combination of failures that cause the top event).
- Quantitative Analysis: Assign probabilities to events to calculate the likelihood of the top event.
- Interpret Results and Take Action: Determine weak points and suggest improvements.
Advantages of Fault Tree Analysis
- Helps in identifying root causes of failures
- Provides a clear visual representation of failure pathways
- Supports decision-making with quantitative risk assessments
- Enhances system reliability and safety
- Assists in regulatory compliance and audit readiness
Limitations of Fault Tree Analysis
- Requires detailed system knowledge and data
- Can be time-consuming for complex systems
- Assumes events are statistically independent
- May become large and complex for extensive systems
Real-World Applications of FTA
- Aerospace & Aviation: Analyzing critical flight systems and reducing accident risk
- Nuclear Power Plants: Ensuring safety and avoiding reactor failures
- Oil & Gas Industry: Preventing blowouts, leaks, and other catastrophic events
- Manufacturing: Maintaining reliability of machinery and automated systems
- Fire Safety: Identifying causes of fire alarm or suppression system failures
FTA vs. Other Tools
| Tool | Type | Focus | Example |
|---|---|---|---|
| FTA | Deductive | Top-down failure cause | Why did the fire alarm fail? |
| FMEA | Inductive | Bottom-up component failure | What happens if sensor X fails? |
| HAZOP | Brainstorming | Process deviations | What if pressure increases? |
Conclusion
Fault Tree Analysis is an invaluable tool for anyone involved in risk assessment, safety, or systems engineering. By visualizing the paths to failure and calculating probabilities, it helps professionals take proactive steps to reduce risk and improve system integrity.


